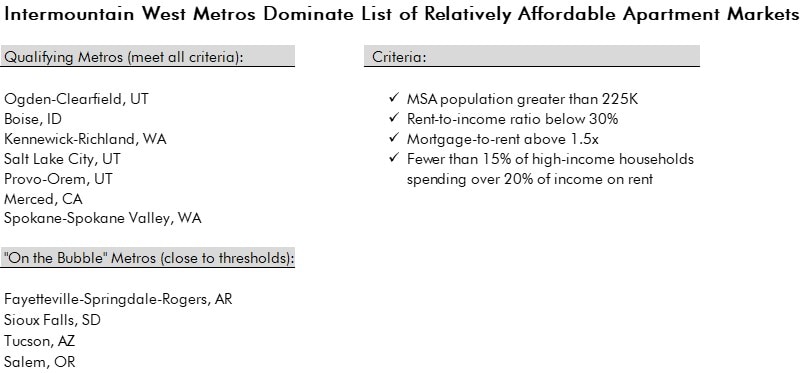
Where are the most affordable apartments markets?
Somewhat surprisingly, they’re mostly in the Western U.S. (and specifically in the Intermountain West).
To measure apartment affordability, we analyzed the largest 185 Metropolitan Statistical Areas (MSAs) on three variables:
· Median rent-to-income ratios
· Average mortgage-to-rent ratios
· The share of earnings that high-income households spend on rent
With these metrics, we’re looking for relative affordability – in other words, how affordable are rents in a given market given the area’s income levels and also versus alternatives in the for-sale market.
At first blush, many metro areas across the Western United States show up as relatively affordable apartment markets when analyzing the first two metrics.
Two major factors are behind this finding: high incomes and expensive housing markets.
Average mortgage payments for recently sold homes in Western metro areas are more than 50% more expensive than typical rent payments. In many of these markets, including high-tech hubs such as San Francisco and Seattle, high median incomes also give the appearance that rents are relatively affordable versus incomes.
When we layered on the third metric, looking at high-income household spend on rent (high-income defined as a household earning over $75K/year), many of the high-cost Western tech hubs (including San Francisco, Seattle, and San Jose), fell off of our list. In those markets, even the wealthiest are becoming rent burdened as they opt for increasingly expensive Class A units with significant amenities and services.
Only 7 metro areas passed our affordability thresholds for all three metrics (see below for specifics) – and 6 of these metros are in the Intermountain West region, roughly the area between the Rockies and the Sierra Nevada/Cascade mountain ranges. Many of the markets in this region have seen a significant influx of high-income households since the Pandemic, with rental markets that are still playing catch-up.
Working with our clients to determine target markets for development and investment, we often start with variables like these and add in analyses around migration patterns, supply pipeline, economic drivers, and submarket specifics. We’ll explore some of these factors in future posts.


Miami vs. Orlando: Very Different Migration Trends

Florida and Texas Metros Accounted for 85% of U.S. Net Population Growth Post-Pandemic

Austin’s Recent Growth Has Been Driven by Its ‘Burbs
We use cookies to ensure you get the best experience on this website. Continue to use the website as normal if you accept this. For more details read our privacy statement.